
Note
Go to the end to download the full example code.
Curvature correction of a photograph#
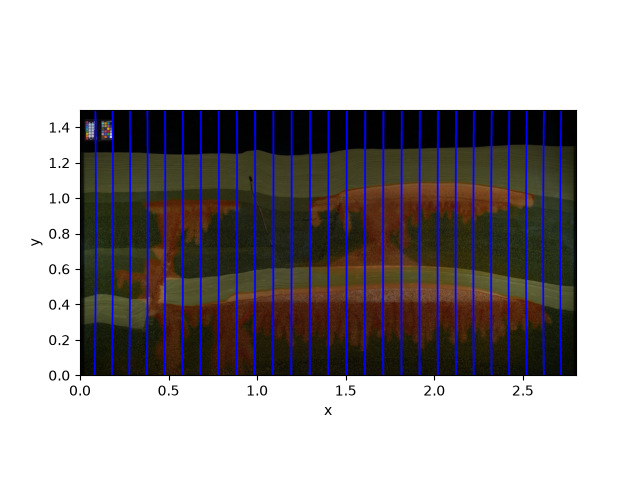
A wide-angle photograph of a FluidFlower rig is barrel-distorted. A
CurvatureCorrection straightens it; overlaying a metric grid
before and after makes the effect visible.
import json
import os

import darsia

folder = os.path.join("..", "images")
path = os.path.join(folder, "co2_2.jpg")

with open(os.path.join(folder, "config.json"), "r") as f:
    config = json.load(f)
curvature_correction = darsia.CurvatureCorrection(config=config["curvature"])
/home/runner/work/DarSIA/DarSIA/src/darsia/corrections/shape/curvature.py:193: UserWarning: No image provided. Please provide an image or a config file.
  warn("No image provided. Please provide an image or a config file.")
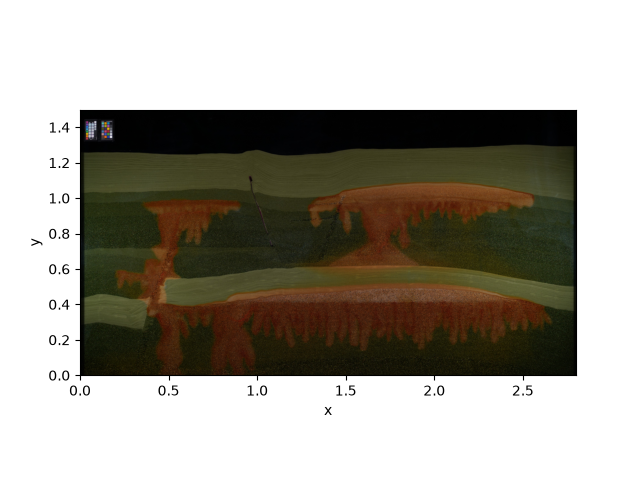
Read the image with the correction applied.
corrected = darsia.imread(
    path=path, transformations=[curvature_correction], width=2.8, height=1.5
)
corrected.show("corrected")
Warning: No exif metafile found. Please install ImageMagick to read metadata from terminal.
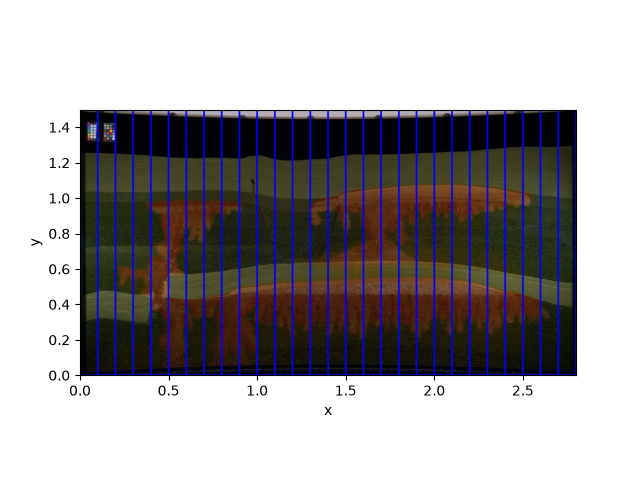
The original with a regular grid, and the same grid pushed through the correction – the grid lines bend to show how pixels are remapped.
original = darsia.imread(path, width=2.8, height=1.5)
original_grid = original.add_grid(origin=[0.0, 0.0], dx=0.1, dy=0.1)
original_grid.show("original + grid")

corrected_grid = darsia.OpticalImage(
    img=original_grid.img,
    transformations=[curvature_correction],
    width=2.8,
    height=1.5,
    color_space="RGB",
)
corrected_grid.show("corrected + deformed grid")
Warning: No exif metafile found. Please install ImageMagick to read metadata from terminal.
Clipping input data to the valid range for imshow with RGB data ([0..1] for floats or [0..255] for integers). Got range [0.0..125.0].
Clipping input data to the valid range for imshow with RGB data ([0..1] for floats or [0..255] for integers). Got range [0.0..125.0].
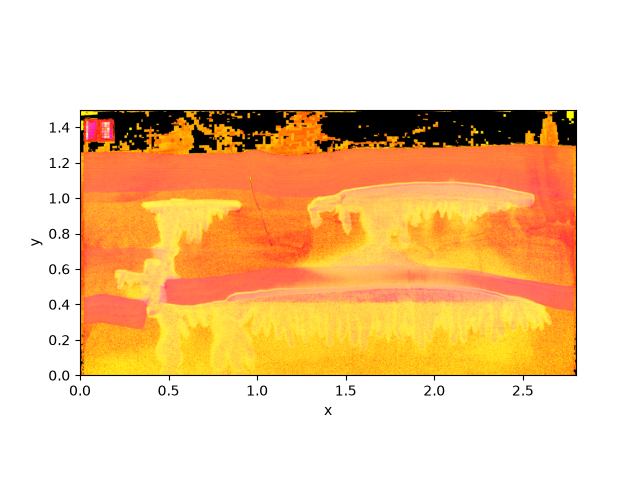
Colour-space conversions on the corrected image.
hsv = corrected.to_trichromatic("hsv", return_image=True)
hsv.show("HSV")

red = corrected.to_monochromatic("red")
red.show("red channel")
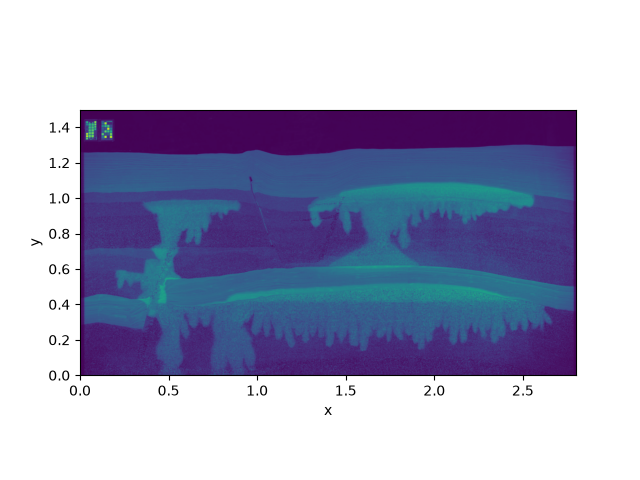
Clipping input data to the valid range for imshow with RGB data ([0..1] for floats or [0..255] for integers). Got range [0.0..358.974].
Total running time of the script: (0 minutes 4.278 seconds)