Ctrl+K
DarSIA 1.1 - Home DarSIA 1.1 - Home
  • Getting started
  • User guide
  • Examples
  • API reference
  • Contributor guide
  • Release notes
  • About
  • GitHub
  • GitHub
  • Getting started
  • User guide
  • Examples
  • API reference
  • Contributor guide
  • Release notes
  • About
  • GitHub
  • GitHub

Section Navigation

  • Reading & writing images
    • Reading a NumPy array
    • Reading a sequence of optical images
    • A first DarSIA image
  • Corrections
    • Colour correction with a colour checker
    • Curvature correction of a photograph
  • Restoration
    • Total-variation and H1 regularization
  • Segmentation
    • Geometry segmentation of a layered medium
  • Image registration
  • Concentration analysis
    • Tracer concentration from two images
    • Kernel interpolation for concentration
  • Distances
    • Earth Mover’s / Wasserstein distance
    • Wasserstein: splitting a square
    • Wasserstein distance: solver development script
  • Paper reproductions
  • Examples
  • Concentration analysis

Concentration analysis#

Turning image sequences into physical concentration, tracer and CO2 maps, and calibrating the underlying models.


<no title>

Example script for simple image analysis. By comparison of images

<no title>

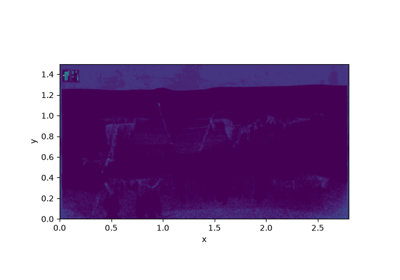
Test phase segmentation, taken from FluidFlower analysis conducted in the work

Tracer concentration from two images

Tracer concentration from two images

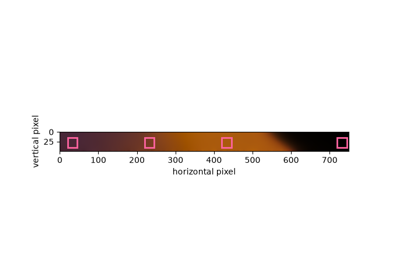
Kernel interpolation for concentration

Kernel interpolation for concentration

previous

<no title>

next

<no title>

© Copyright 2023-2026, DarSIA developers.

Built with the PyData Sphinx Theme 0.22.0.